Date range
Use the date picker to filter all metrics by a specific time period. Select from preset ranges or define a custom date range to analyze historical performance.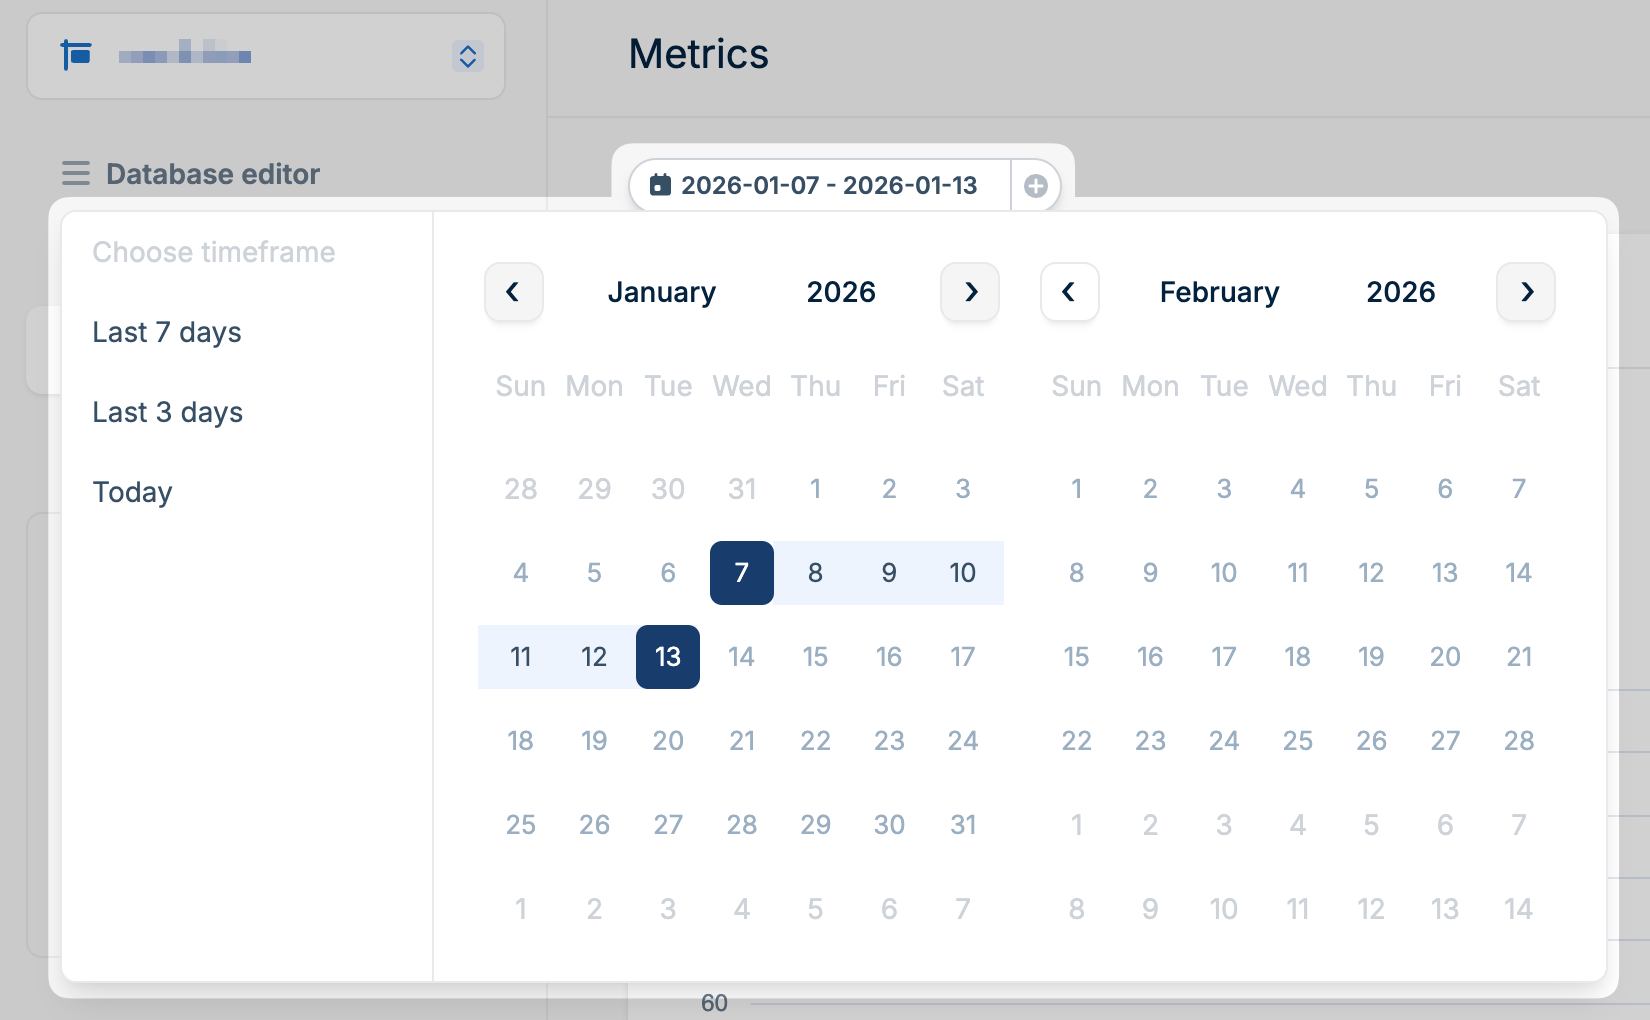
Available metrics
Rows read and written
Track the number of database rows read and written over time. This metric helps you understand your database workload and identify usage patterns.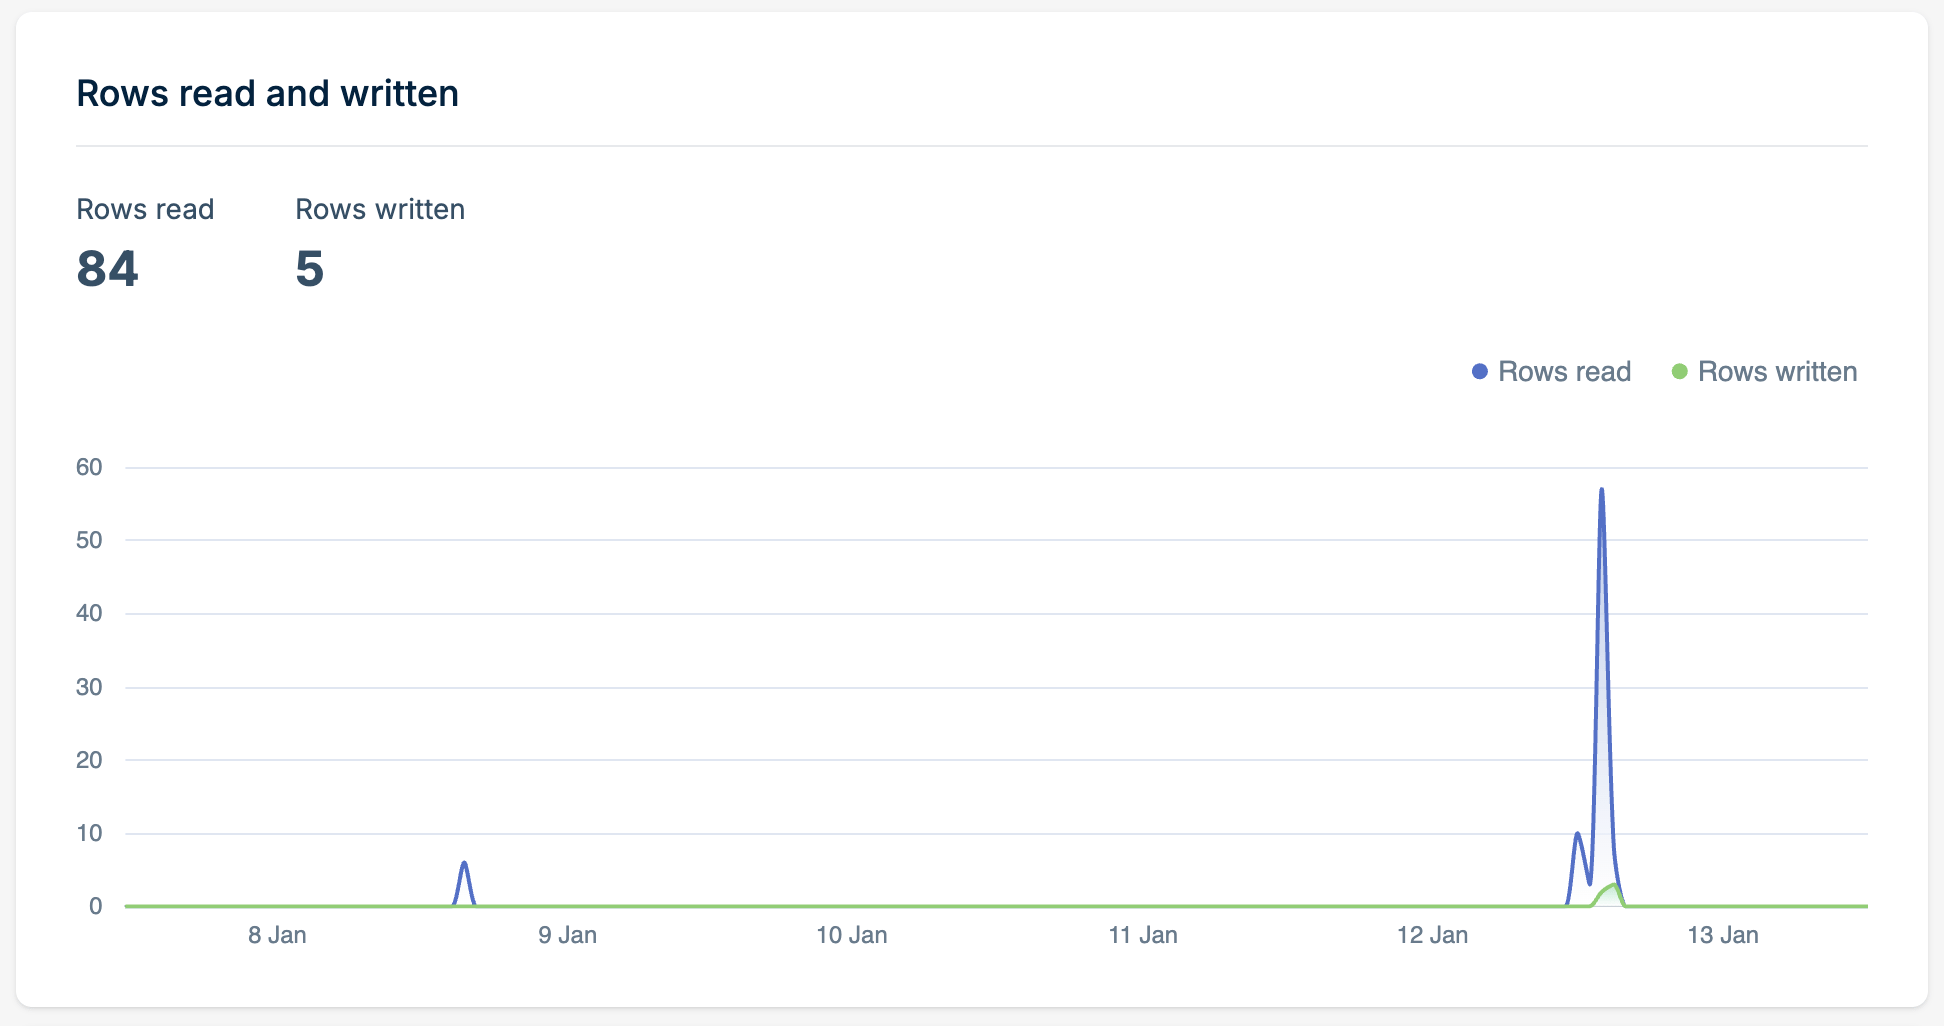
High read counts may indicate opportunities for caching or query optimization. Sudden spikes in writes may indicate bulk operations or potential issues worth investigating.
Latency
Monitor query response times across different percentiles to understand your database performance characteristics.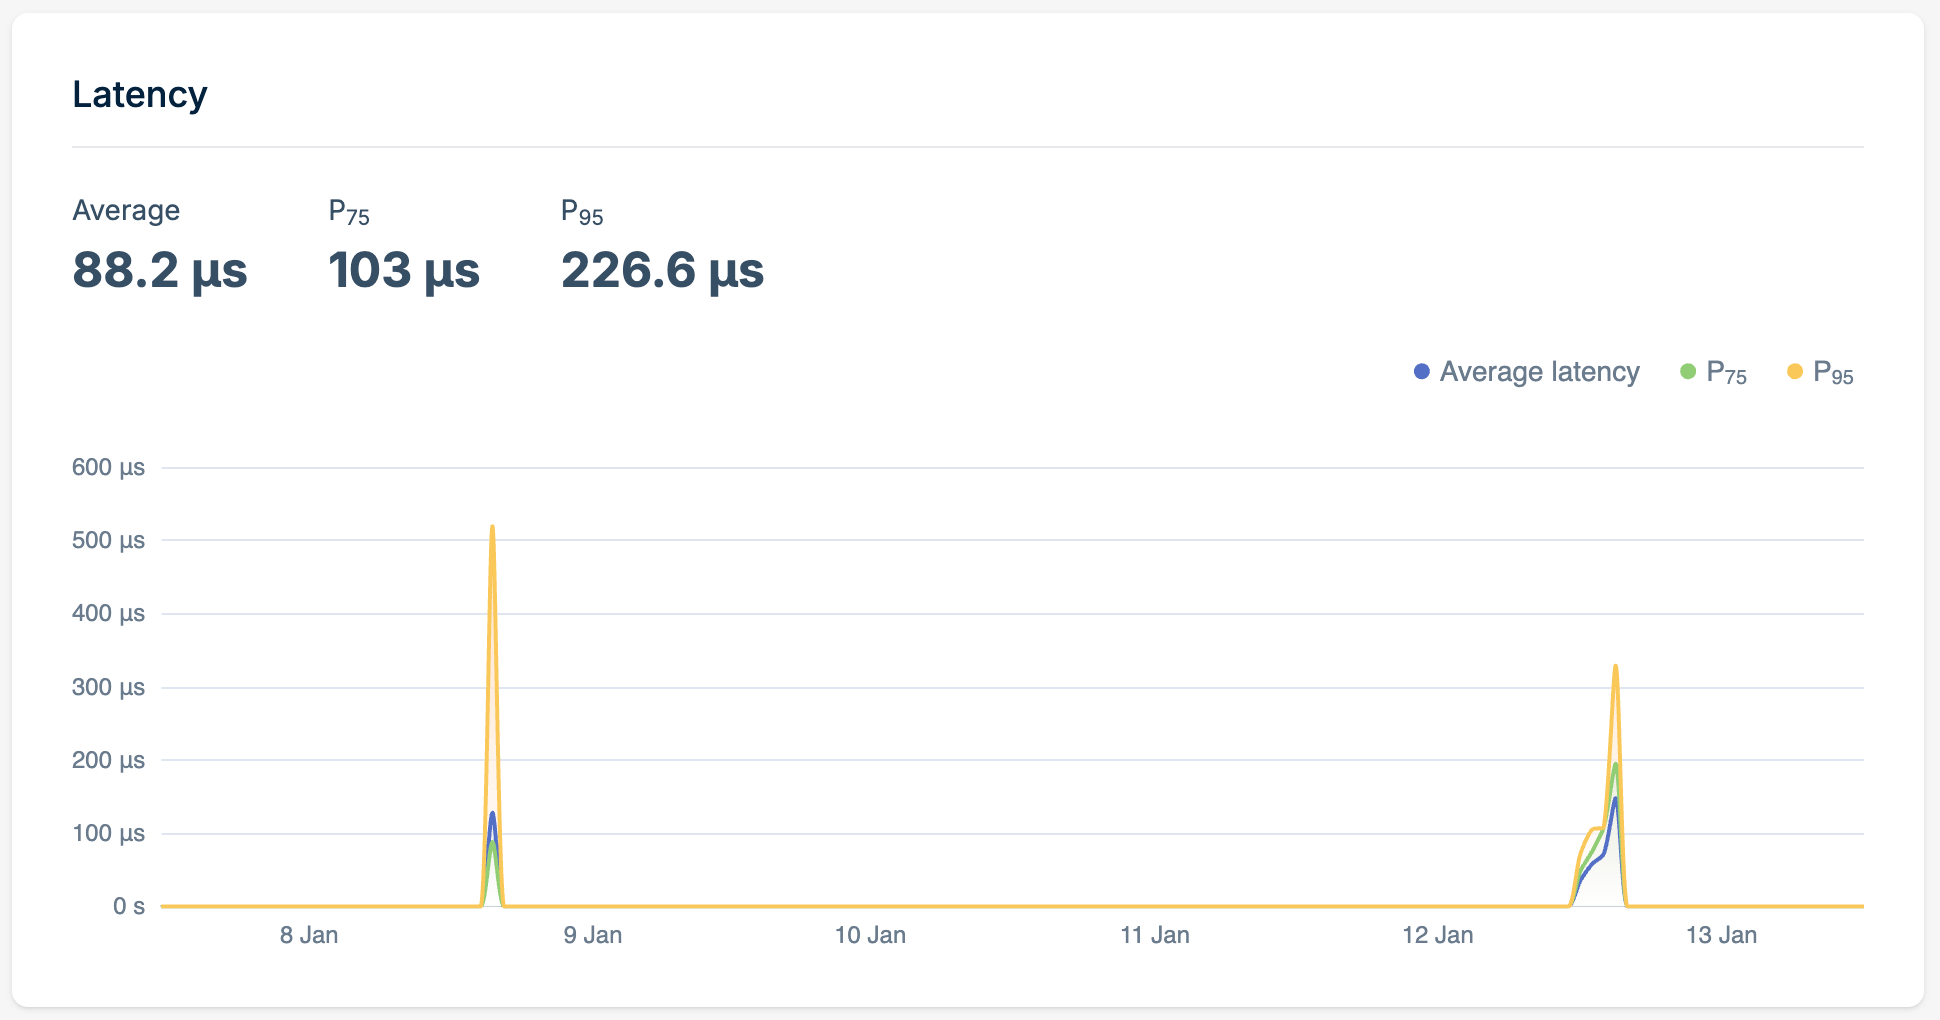
Average latency should remain consistent over time. Increases may indicate growing data volumes or query complexity. A large gap between P95 and average suggests some queries need optimization. Consider adding indexes or restructuring slow queries.
Query count
View the total number of queries executed against your database over time. Correlate query volume with application traffic to ensure expected behavior and identify unusual patterns.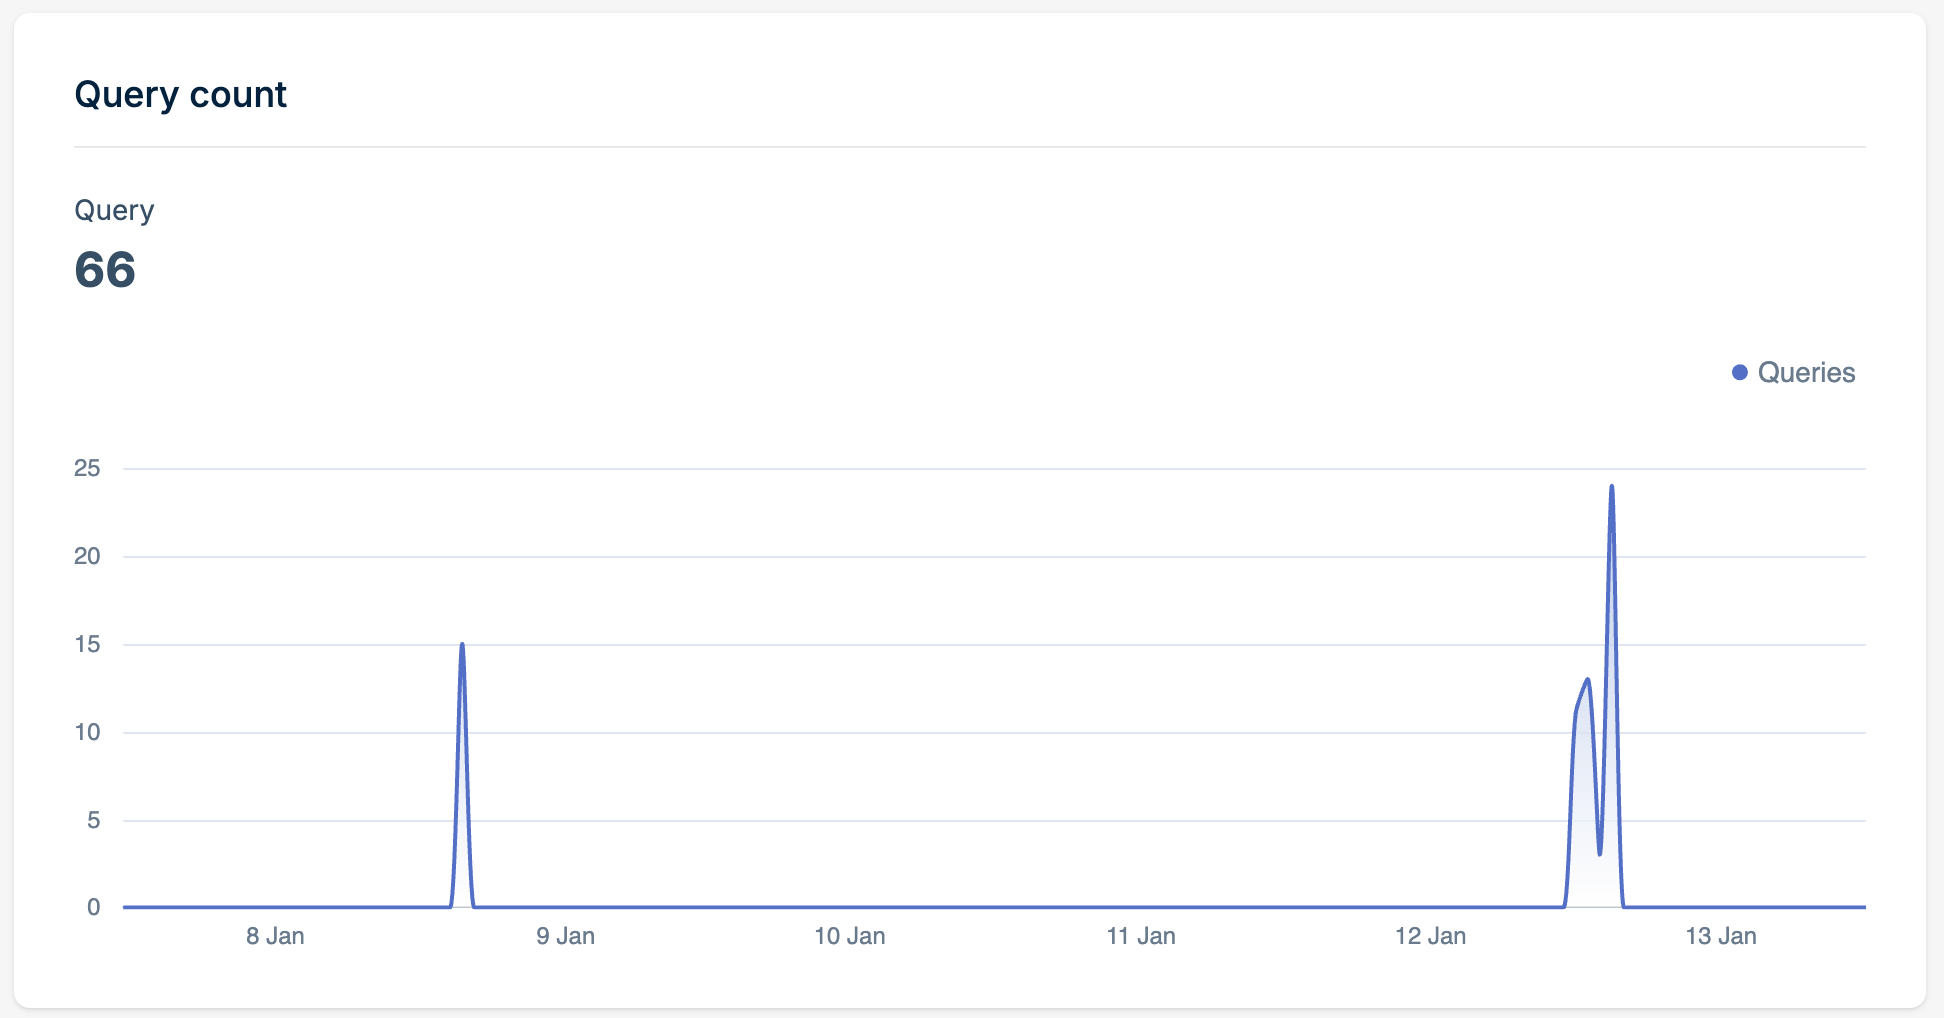
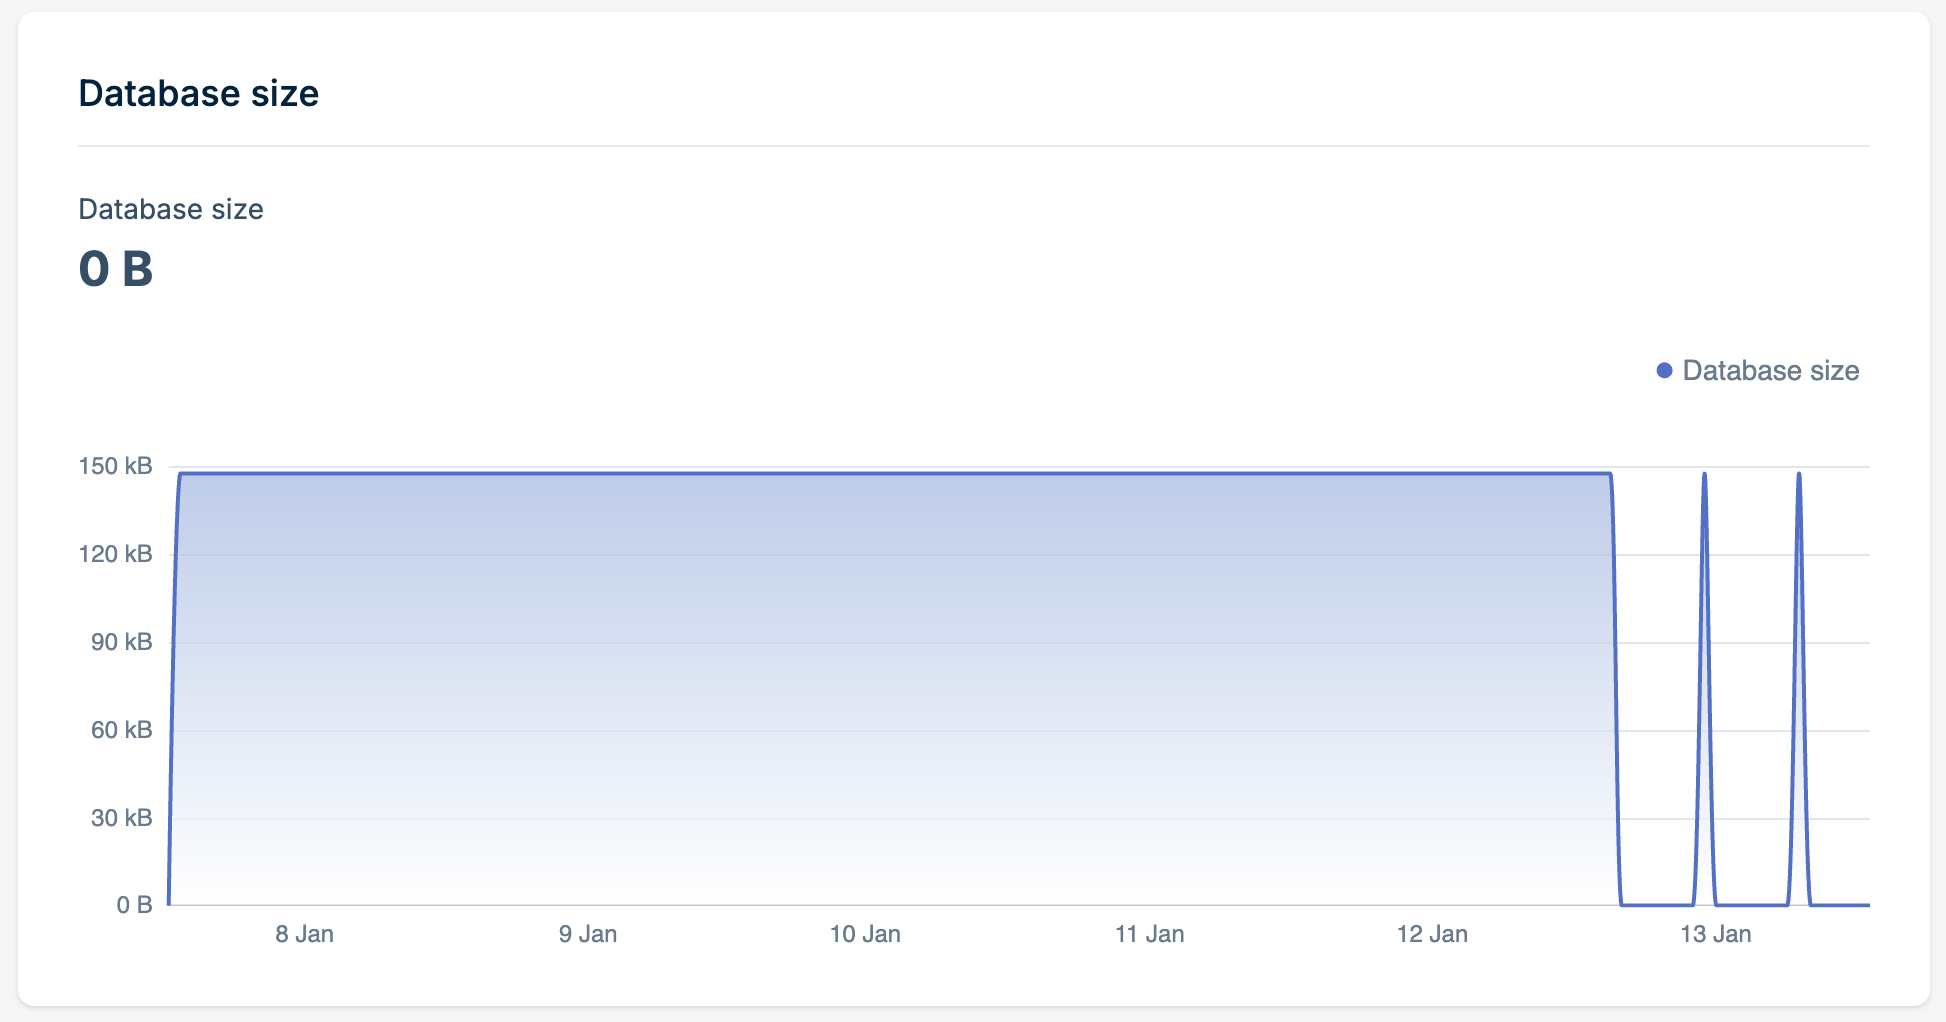
Database size
Monitor your database storage consumption over time. This metric shows the total size of your database including all tables, indexes, and metadata. Track growth trends to plan for scaling and identify unexpected increases.